
(1) Spatial imprecision after smoothing: Spatial smoothing has a nonlinear effect on the voxel variances. For example, when smoothing over two regions with a positive contrast but independent error terms, the minimum variance is found between these regions.
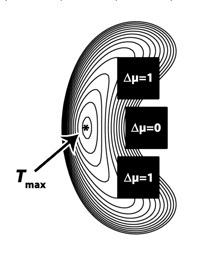
Figure (worst case): 2D-Simulation of three black squares (5*5pixel) representing gray matter, surrounded by white matter. A positive contrast Δµ=1 is present in the upper and the lower region, in the middle, there is only noise, no signal. Note that after smoothing with a FWHM = 14pixel, the nearest gray matter of Tmax is the region with Δµ=0!
(2) Another question is that of which quantitative measure the investigator is interested in most. A statistical measure, for example, a t-value, allows to test if an estimated parameter (=contrast) differs significantly from zero, that is, if a 'true effect' has been observed. In other words, the t-map reflects the 'signal-to-noise' ratio, where 'noise' comprises measurement errors as well as authentic between-subject variance that is not explained by the statistical model. However, if there is no doubt about the significance of a finding, the investigator may be interested in the signal itself (e.g. a between-group difference of receptor availability) rather than a measure that depends on the local noise.
(3) The strength of the standard SPM procedure is to detect significant findings. A more difficult if not impossible challenge is to determine the exact outline of an effect. Many people choose the original voxel-level threshold to define the displayed region, however this is not without problems: first, any t-threshold is subject to the same artifacts as described above. Second, this threshold may be too conservative with respect to the outline of a finding and may thus reveal only the tip of the iceberg. What is the a priori likelihood for a voxel next to a (statistically proven) true effect? I don't know, but I believe that - once a cluster is significant - we can afford more liberal thresholds for illustrative purpose.