
A list of all suprathreshold clusters will be automatically generated when both t-thresholds ("original threshold" and "secondary threshold") are defined. The screen then should look like this:
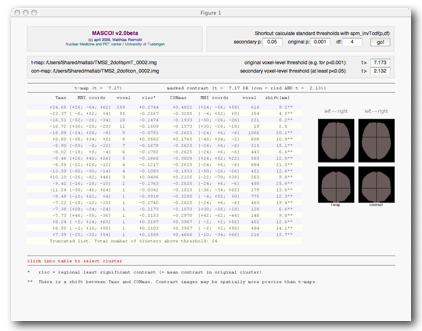
If you do not know the t-values, you can simply click on
[go!] (upper right corner), then MASCOI will calculate them
from the specified p-values and the number of degrees of
freedom. When loading the t-map, MASCOI obtaines the
degrees of freedom from the ASCII comment in the header
file (spmT*.hdr). To me this appears a little quick and
dirty, but it works. No guarantee, as always...
If the primary ("original") t-threshold is the same as the
one used during the SPM analysis, the displayed list (to be
more precise, the left part of it) should match the SPM
report (it differs in that clusters are ordered only by
size and negative clusters are also shown).
MASCOI allows to set a more liberal "secondary" threshold
that can be used to create enlarged clusters for
illustrative purpose. You can explore your data by setting
any threshold, however it is strongly recommended to set a
secondary threshold of at least p=0.05.
Please have a look at the rightmost column ("shift [mm]").
It shows how far the corresponding local maxima in the
t-map and the contrast map are apart.
Left-Right
flipping
The byte order in *.img files varies between labs and SPM
versions. MASCOI calls SPM to determine if the images are
to be left-right flipped or not. Some uncertainty remains,
e.g. when using old data with a new version of SPM. If you
are running MASCOI for the first time or if you feel unsure
about left and right, compare MASCOI's list (MNI x<0 is
left by definition) with an external reference. You can
check/change the current settings by clicking on
X-Flip at the menubar.