
To get more information for a single cluster, click [more] and you will be asked to load an anatomical image (format: *.img or *.mnc).
MASCOI shows you the coronal and transversal slices that go through the peak t-value and the peak contrast, respectively. MASCOI also creates a statistic of atlas labels:
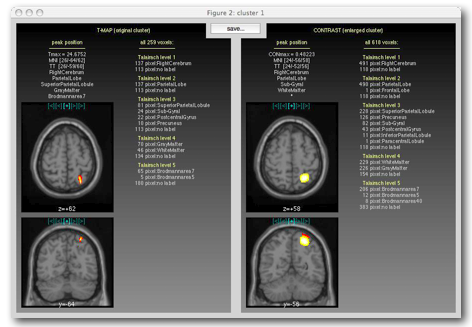
By clicking on the blue (cyan) symbols on top of each
image, you can choose between the slice that goes through
the maximum ([+]) and one of the 4 adjacent slices.
You can view a list of subpeaks with the following command:
>>
mascoi('subpeaks', CLUSTER_ID, DIST)
with
CLUSTER_NUMBER = number
of the cluster (by appearance in the list)
DIST =
minimum distance between two subpeaks [voxels].